
What is a Gantt Chart?
A Gantt Chart, also known as Gantt Diagram, Gantt planning, or bar chart, is a useful tool for planning long-term projects. It is a horizontal bar chart used to illustrate a timeline of a project, program, or work, and then track its progress. It is a visual way to create overview and structure within a project. You can use a Gantt Chart to give everyone an idea of how tasks are allocated and which resources are assigned to them. This way, you have a clear picture of the project's status.
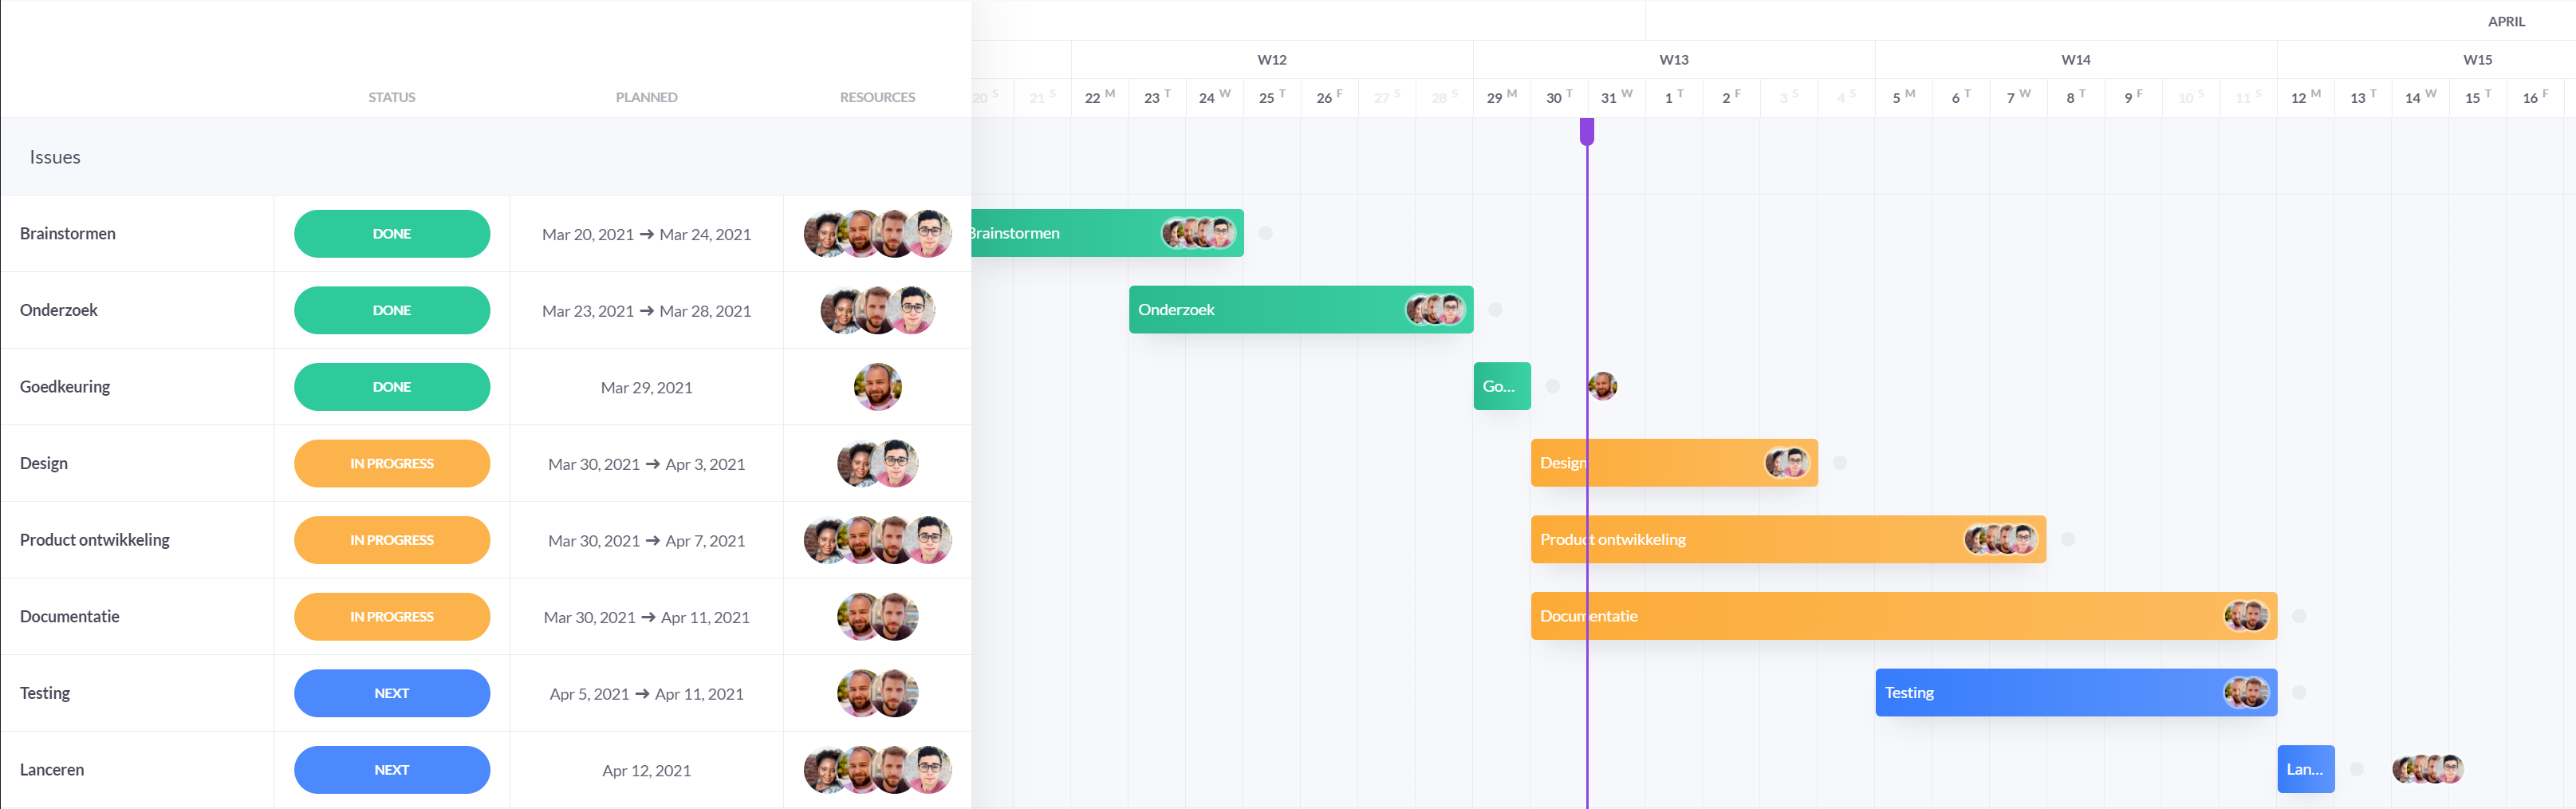
What are the benefits of a Gantt Chart?
- Clarity: A Gantt Chart provides all tasks and timelines in one clear overview over a often broad period. You are more efficient in utilizing the time of various team members and project workers. With clarity, tasks can be smartly distributed and picked up.
- Better communication: Teams use Gantt Charts to replace meetings and status updates. Team members constantly have a clear overview of the progress of all tasks, without the need for regular meetings.
- Insights into performance: Thanks to the clear project overview, team members gain more insight into their performance and can better align their own work habits with the project schedule. Conversely, they will be more aware of the interrelationships between tasks and gain more insight into the impact of delays. This promotes good collaboration and helps you distribute tasks efficiently.
- Efficient time management: Gantt planning helps you create realistic schedules. The different bars indicate when a particular task should start and be completed. This way, you can also ensure that other projects that consume resources and time are not compromised.
- Flexibility: Projects are often subject to change. By having an overview of unexpected shifts in scope or time, you can more easily adjust tasks and resources accordingly.
Components of a Gantt chart
When creating a Gantt Chart, Regardless of how detailed you get, a Gantt Chart typically consists of
- The project's due date
- All tasks within the project
- The start and end date for each task An estimate of how long the task will take
- The person responsible for each task
- Grouping or categorizing tasks
How to use a Gantt Chart in vPlan?
- Add tasks with start and end dates
All tasks taking place in the project must be entered in vPlan with start and end dates. By filling in the start and end dates, tasks are displayed as bars on the timeline.
- Clearly indicate dependencies between tasks
In a project, not all tasks can usually start at the same time. To ensure smooth project execution, you can visualize the dependencies between tasks on the timeline. Give a status to all your tasks, and for each status, assign a different color to the bar. This creates a visually appealing and clear overview.
- Adjust work as plans change
You will find that certain tasks sometimes take longer than planned, and others shorter than planned. In the timeline, you can easily adjust this by changing the start and end dates or by shifting the bars.
Why use vPlan for your Gantt Chart?
Insight into capacity: Always have insight into your available resources. Within vPlan, you can add available resources, machines, or employees to your Gantt Chart.
All your pending work at hand:
With the backlog within vPlan, it is possible to plan cards on the timeline. Simple and quick with drag and drop.
Different perspectives
You can view the timeline from different perspectives:
- Phases
- Resources
- Collection of cards (orders and projects)
Flexible coloms
With vPlan, you can determine which columns you want to see within your Gantt Chart.
Optimal display
You can collapse empty white space within your Gantt Chart in vPlan, creating an even better overview.
Frequently asked questions
What is a Gantt planning?
A Gantt planning is a project planning displayed in the form of a timeline. All tasks, responsibilities and milestones are shown alongside each other, divided by time. This makes it easy to see which tasks run in parallel, which ones block each other, and where bottlenecks arise. Gantt planning is ideal for production, construction, IT, marketing, and any team that works with deadlines.
How do I create a Gantt planning?
You create a Gantt planning in five steps:
- Make a list of all tasks within your project or process.
- Add start and end dates to each task.
- Define dependencies: which tasks need to come first?
- Visualise the tasks as bars on a timeline (e.g. in Excel or project software).
- Plan resources, deadlines & progress to keep your planning up to date.
In tools such as vPlan, you can follow these steps: you drag tasks, set dependencies, and the planning updates automatically.
What does Gantt stand for?
The term Gantt refers to Henry Gantt, an American engineer and management consultant who introduced the modern Gantt chart around 1910. His method became popular worldwide during the First World War and has since become the standard in project management.
What do you use a Gantt chart for?
You use a Gantt chart to:
- visualise project plannings
- manage dependencies
- track tasks and deadlines
- distribute capacity and workload
- monitor milestones and progress
- improve team collaboration
It is one of the most commonly used tools to keep complex projects organised.
What are the advantages of a Gantt chart?
A Gantt chart offers:
- an overview of all tasks and deadlines
- better communication through one central source of truth
- insight into bottlenecks and dependencies
- realistic time management
- flexibility in case of changes
- better capacity planning for teams and resources
With a clear overview, everyone knows exactly what needs to be done.
What are the components of a Gantt chart?
A complete Gantt chart includes:
- Tasks
- Start and end date
- Timeline (days, weeks or months)
- Bars showing the duration of tasks
- Dependencies between tasks
- Milestones
- Resources/team members
- Progress or status of tasks
These components together provide a clear project structure.
What is the difference between a Gantt chart and a Kanban board?
- Gantt chart = planning over time
- Kanban = visualisation of workflow/status
Many teams use both: Kanban for daily execution, Gantt for long-term overview.
How does a Gantt chart help with capacity planning?
With a Gantt chart, you can see:
- who is available when
- which tasks overlap
- where overload is likely
- how resources can be used optimally
In vPlan, this is displayed automatically.

Work at vPlan
We are looking for new colleagues.